Many companies focus on winning new customers as the only growth driver, but a narrow focus on new sales can backfire – Stickiness is just as important. Here’s an introduction to how to measure stickiness, which can be the most important value creator. If you have no stickiness, growth will be an uphill battle.
The best call to receive for any business must be a customer asking, “can I buy more?”. It’s validation of your business model, it’s a limited-effort sale, it’s a happy customer with potential, and it’s recurring revenue straight into the bank account. If you don’t get those calls, it’s lost business and the road to top line growth is longer.

Annual retention rate
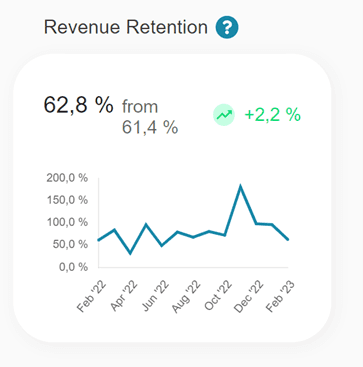
Annual retention rate is the revenue you generate from your existing customers year after year, i.e. How much of your customer business are you able to keep? The most successful companies can keep this rate above 100%, while others experience churn rates above 50% and need to replace these sales with new customers in order to grow. And yes, the best companies deliver over 100% retention rates!
Imagine a software company that sells financial systems on an annual license basis. You have uploaded all your company’s transactions on the platform. The supplier promises product update in accordance with regulations and has a long-term development plan to satisfy your needs. The chances of you ending this relationship must be considered low. It is a relationship that may even last for more than a decade. The license price is not critical to your business, so you don’t pay attention to the annual price increases, and you can purchase additional modules to increase functionality. A retention rate of over 100% may be achievable and new sales are pure growth.
Now imagine a hardware retailer that sells computers, phones, and electronics to your business. If something breaks, if new employees start, or if you need more advanced equipment, you will contact the dealer to order the necessary equipment. You may have a discount agreement with preferred suppliers but are not obligated to buy from a single location. Your purchase depends a lot on the price, on the hardware specification and on the delivery time. Most hardware retailers find that their customers have multiple suppliers and have purchasing patterns that are difficult to service and predict. Having a retention rate of over 50% can be good in this industry. This means that before growth can be delivered, the 50% lost revenue must be replaced first.
The retention rate shows the stickiness of your business model and is a huge value driver. It is an important KPI with great optimization potential.

In the Metriks package, a KPI such as Retention is continuously updated based on your transaction history with your customers. It can be broken down into customer segments, product segments and individual customer levels if you wish. It can be difficult to calculate not having a platform like Metriks – the main components will be summing all transactions in a customer group in the time intervals you want to track and in the sub-components you want to analyze. The most important challenges will be to register start periods and end periods, and to define when a customer has dropped out and when the turnover is a rewin and not retention.
Customer lifetime
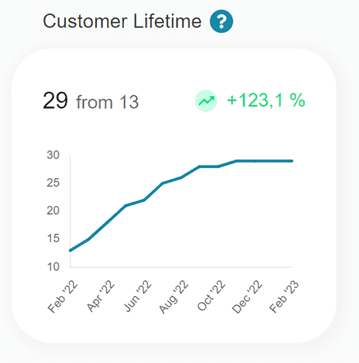
Another key value driver for measuring stickiness is Customer Lifetime (CLT), which is also a major component in maintaining a high Retention Rate. Some industries have the potential to retain customers for a long time, and others must settle with one-off agreements.
CLT can vary considerably within an industry and comparable companies. Imagine a car dealership – do you get your car serviced where you bought the car or elsewhere? Buying a new car will include a warranty that requires regular servicing of your car. The continued service means increased CLT, and the customer value may not be driven by the first purchase but by the length of the CLT. The most successful car dealerships will be those with the highest CLT. CLT varies enormously within an industry depending on the ability to deliver continued value to customers. Value for customers is reciprocated with higher Customer Lifetime Value (CLTV), which is the total turnover of your customer relationship over the entire period.
Again, the Metriks package ensures that you have an up-to-date and functional measure of both your CLT and CLTV that can be broken down into segments. A simple but quick commonly used way to measure your CLT would be CLT = 100/churnrate. The advanced Metrik approach is a CLT weighted for seasonality and turnover fluctuations based on longer-term data, which gives a sophisticated and often different picture. Once you find your CLT, your CLTV will be calculated as CLTV = CLT x transaction value.
CLT and CLTV will give you a unique picture of your stickiness and the full value of your customer relationship. You will most likely realize that the most valuable contribution to your top line growth may not be new customers, but the customers you already have.


