Besides being a key figure to produce your Customer Lifetime Value of a customer, Customer Retention enables you to initiate the right initiatives with the right timing to keep your customers for longer. Common calculations used to calculate future churn and retention are however based on wrong assumptions. Therefore you might end up having useless churn and retention predictions unless you consider that retention does not decay with a constant fraction.
At the heart of any contractual or subscription-oriented business model is the notion of the retention rate. An important managerial task is to take a series of past retention numbers for a given group of customers and project them into the future to make more accurate predictions about customer tenure, lifetime value, and so on. What is commonly done to calculate metrics such as customer lifetime is to assume that the churn is exponential.
If we consider the following data consisting of two customer segments, a regular one and a high-end one:
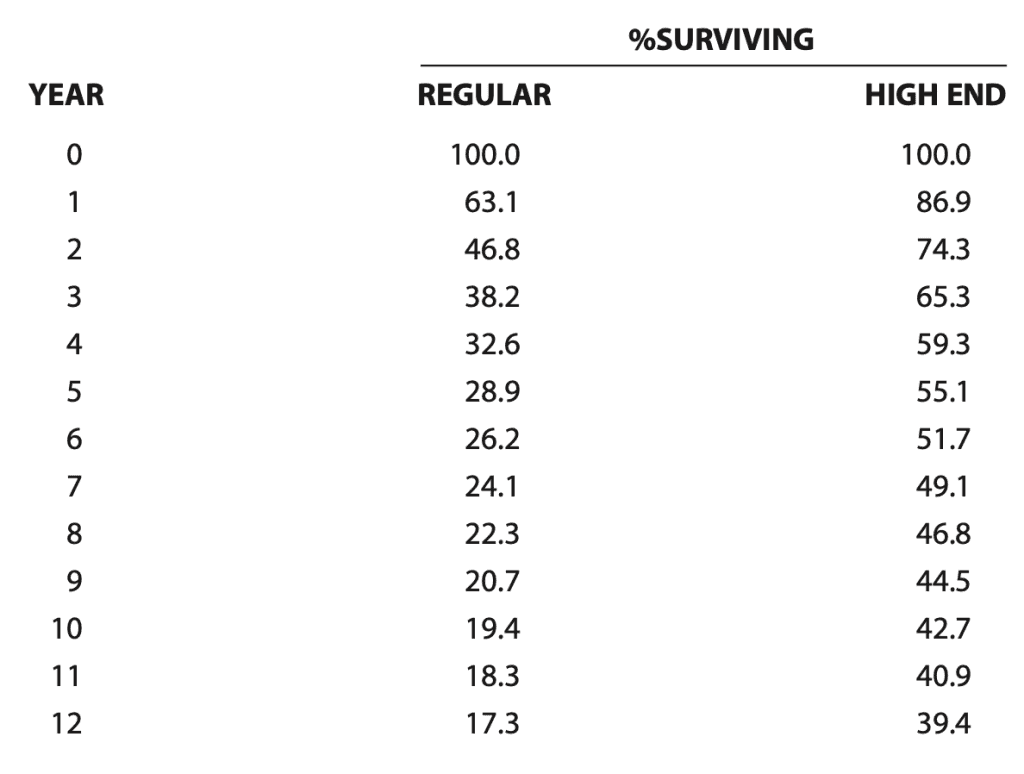
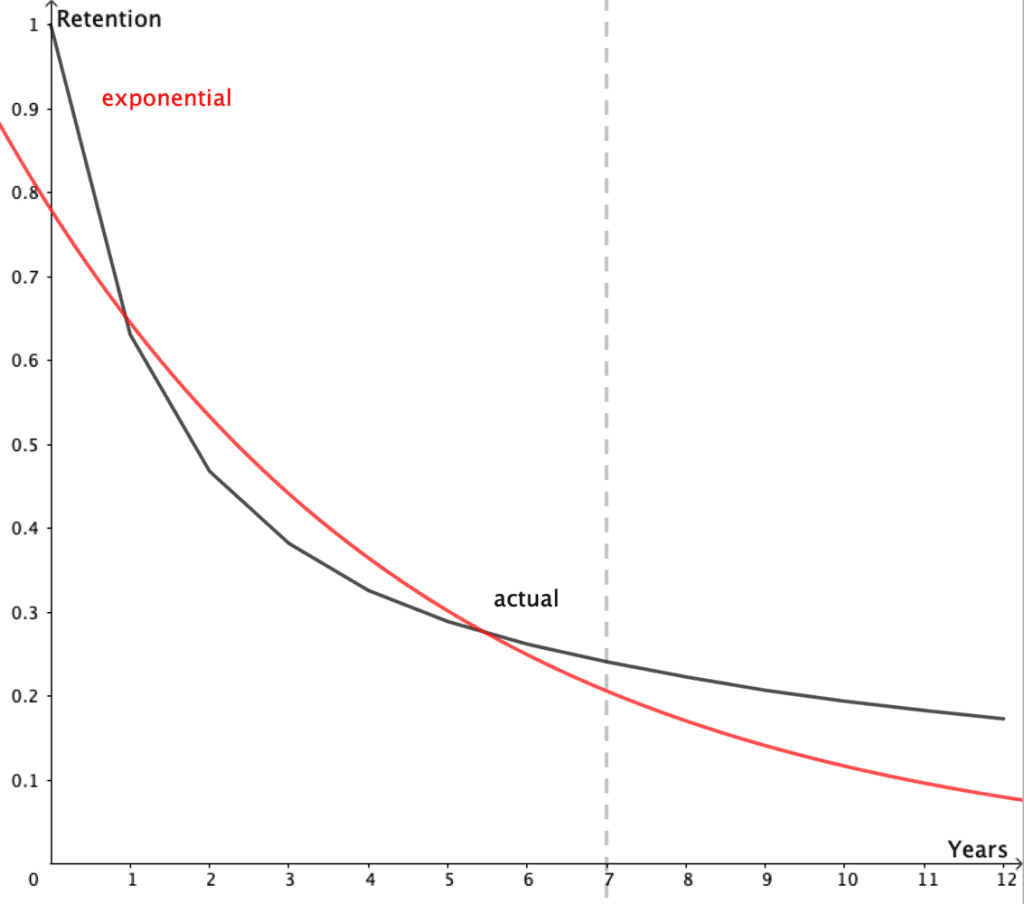
We can then imagine that we only have observed the first 7 years. If we then tried to predict the churn using traditional regression techniques we achieve the following results:
High end:
Regular:
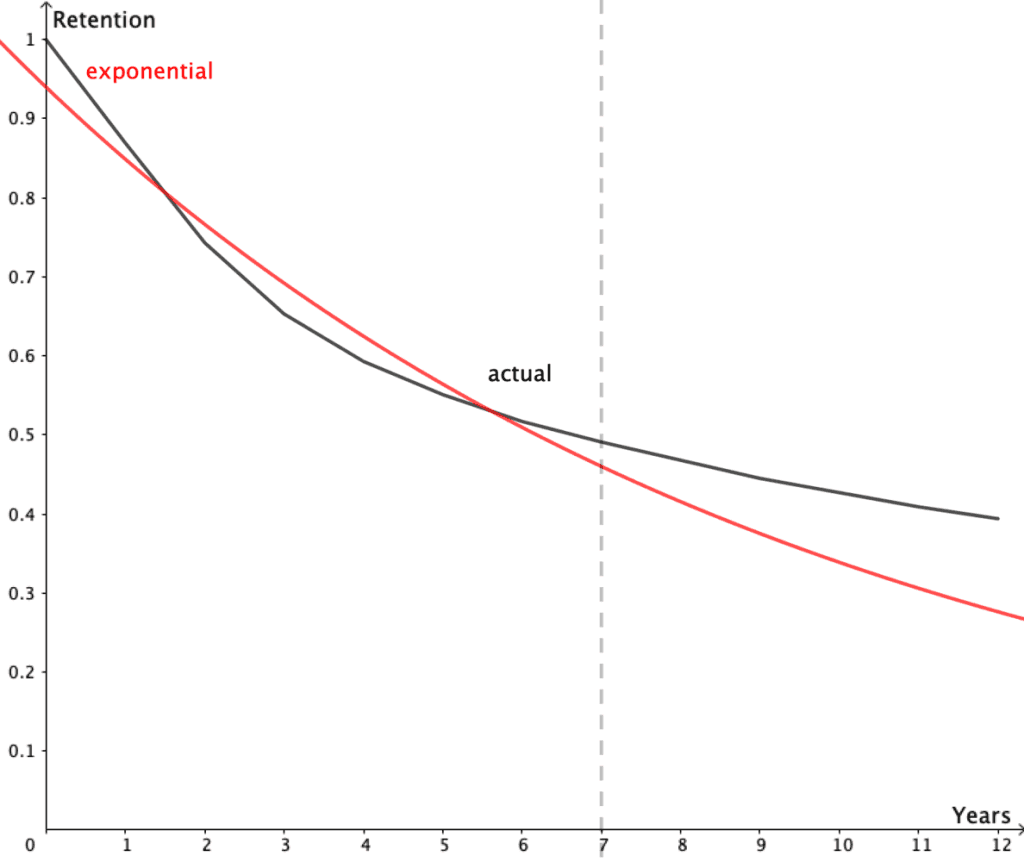
The fits can seem reasonable with a low residual of 0.96375 in the high-end segment. But when we consider the projections beyond the model calibration period, the model breaks down dramatically. For the high-end segment, the exponential models underestimate Year 12 retention by 30%. For the regular customer segment, this is even worse. Here it underestimates the Year 12 retention by 54%. This will surely lead to wrong lifetime estimates (The lifetime can be calculated as the area under the curve).
To circumvent this problem we formulate a probabilistic model of contract duration that is based on a few simple assumptions:
Each time a customer has to renew their membership there is a probability of them churning or staying.
For a given individual, the probability of churning does not change over time.
The probability of churning varies across customers.
The third assumption should not be controversial, as the notion of heterogeneity is central to marketing; however, some readers might find the second assumption contrary to their expectation that retention rates increase over time as the customer gains more experience with the product or service. But rather than overcomplicate our story, we start with the simplest possible set of assumptions and only add supposedly richer “touches of reality” if the model does not “work.”
After doing some math under these assumptions (Fader & Hardie) we have the following expression for the (aggregate) retention rate
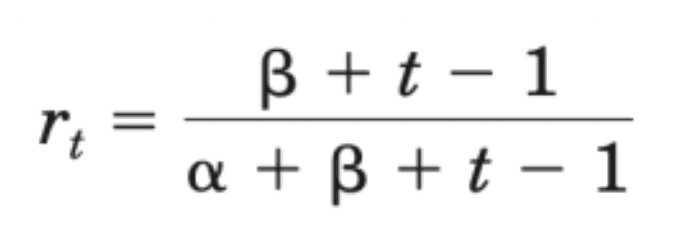
We immediately see that the retention rate is an increasing function of time, even though the underlying (unobserved) individual-level retention probability is constant. According to this model, there are no underlying time dynamics at the level of the individual customer; the observed phenomenon of retention rates increasing over time is simply due to heterogeneity (i.e., the high-churn customers drop out early in the observation period, with the remaining customers having lower churn probabilities). This well-known “ruse of heterogeneity” (Vaupel & Yashin, 1985) is often overlooked by those attempting to make sense of various aggregate patterns of customer behavior.
If we fit the model to the first 7 years of the data presented. For the High End and the regular segment.
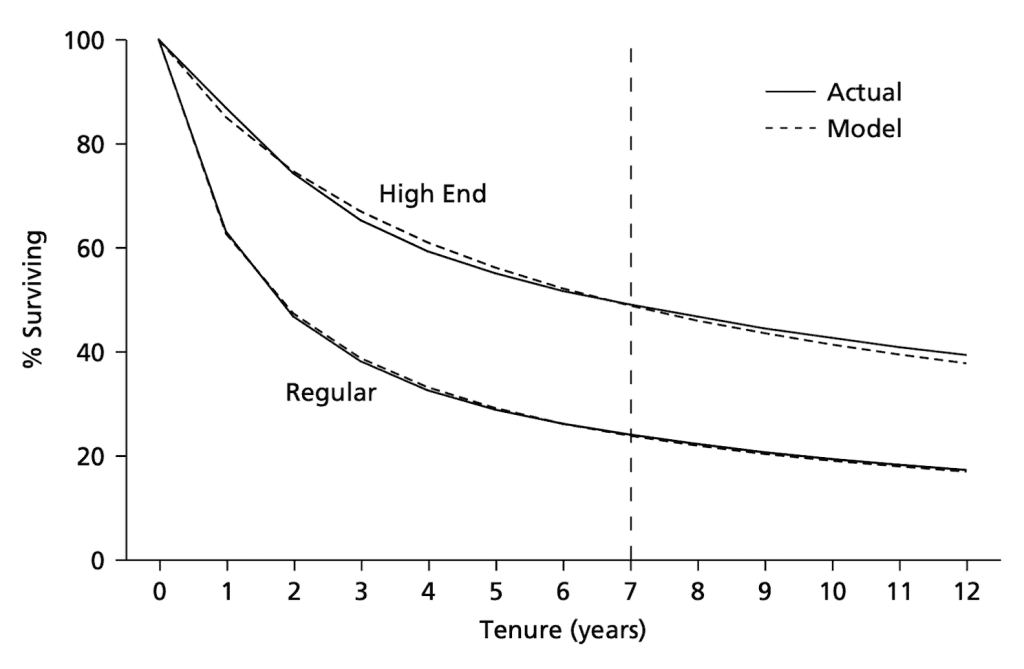
Actual Versus sBG-Model-Based Estimates of the Percentage of Customers Surviving at Least 0–12 Years for the High End and Regular Segments (Fader & Hardie)
The resulting predictions are almost too good to be true; the model overestimates Year 12 survival by only 4% and 2% for the High End and Regular segments, respectively.
It should be noted that not all retention curves are similar and these results could vary across different kinds of businesses. The main point is however that because customer lifetime is often calculated based upon an assumption of exponential churn it is rarely the case that this model holds.
References:
Peter S. Fader & Bruce G. S. Hardie,
Fader, P. S., & Hardie, B. G. S. (2007). How to project customer retention.Retrieved August 23, 2022, from https://faculty.wharton.upenn.edu/wp-content/uploads/2012/04/Fader_hardie_jim_07.pdf
Vaupel, J. W., & Yashin, A. I. (1985). Heterogeneity’s Ruses: Some Surprising Effects of Selection on Population Dynamics. The American Statistician, 39(August), 176–185.


